캐나다에 한파가 몰아쳐서 밖에 돌아다니기도 춥우니 방콕만 했던 주말이였습니다. 인구 70만의 작은 도시에 공립수영장이 열개가 넘개 있어서 기본적인 운동을 위해 수영만 하고 내내 주식분석과 프로그램을 살펴보곤 했습니다.
요즘은 인공지능알고리즘을 네이버나 다음같은 곳에서도 간단한 절차를 통해 제공해 주고있고 복잡하지 않은 프로그램과 예제등으로 쉽게 적용해 볼 수 있어서 좋았습니다.
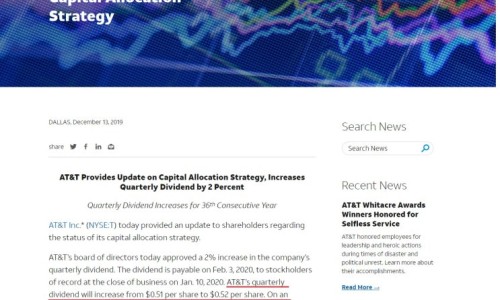
이런 놀라운시대에 빠른 통신망을 제공해주는 통신주와 핵심 분석능력을 제공해주는 구글같은 플랫폼회사들의 가치는 더욱 더 오르리라 믿으며 제 포트에도 지속적으로 관리중입니다. 특히 at&t 는 타임워너 인수이후 주가 낙폭이 너무 심해고 베당이 삭감 되니 마니 하던 종목인데 최저점에서 매수해서 시세차익 25프로 그리고 올해 배당만 5프로수익이 예정되어 있는 최애 종목입니다. 더군다나 배당도 증액이 예정되어있어 감사할 뿐입니다. 미국을 다녀보면서 버라이존과 at&t의 확고한 지배력을 느꼇기 때문에 저가에 담을 수 있었다고 생각합니다.
관련 내용을 잘 설명한 블로그가 있어 참고 링크 걸어둡니다.
얼굴인식 api를 블랙핑크 그룹에 적용한 파이선 예제입니다.
인터넷에서 이곳저곳 가져온 소스를 짜집기 해봤습니다.
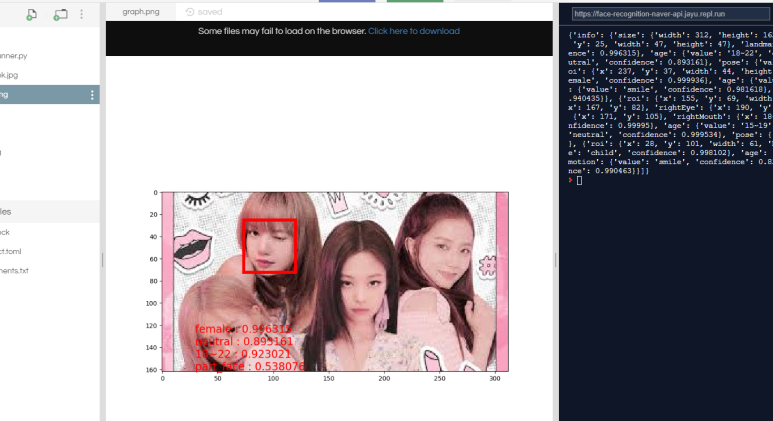
멤버 4명중 한명만 적용해봣는데 여성, 나이, 감정상태(중립) 등으로 비교적 정확하게 컴퓨터가 인식해서 깜짝놀랐습니다.
import os
import sys
import requests
import matplotlib.pyplot as plt
import matplotlib.image as mpimg
import matplotlib.patches as patches
import numpy as np
import json
#import urllib.request
#from PIL import Image, ImageDraw
img = mpimg.imread("blackpink.jpg")
file_name = 'blackpink.jpg'
client_id = "네이버아디"
client_secret = "키"
url = "https://openapi.naver.com/v1/vision/face"
#url = "https://openapi.naver.com/v1/vision/celebrity"
files = {'image': open('blackpink.jpg', 'rb')}
headers = {
'X-Naver-Client-Id': client_id,
'X-Naver-Client-Secret': client_secret
}
response = requests.post(url, files=files, headers=headers)
rescode = response.status_code
detect_result = json.loads(response.text)
detect_summary = detect_result['faces'][0]
print(detect_result)
x, y, w, h = detect_summary['roi'].values()
gender, gen_confidence = detect_summary['gender'].values()
emotion, emotion_confidence = detect_summary['emotion'].values()
age, age_confidence = detect_summary['age'].values()
pose, pose_confidence = detect_summary['pose'].values()
fig, ax = plt.subplots(figsize=(10, 10))
ax.imshow(img)
rect_face = patches.Rectangle((x, y),
w,
h,
linewidth=5,
edgecolor='r',
facecolor='none')
ax.add_patch(rect_face)
annotation = gender + ' : ' + str(gen_confidence) + \
'\n' + emotion + ' : ' + str(emotion_confidence) + \
'\n' + age + ' : ' + str(age_confidence) + \
'\n' + pose + ' : ' + str(pose_confidence)
plt.figtext(0.2, 0.3, annotation, wrap=True, fontsize=17, color='red')
plt.show()
plt.savefig('graph.png')
#if (rescode == 200):
# print(response.text)
# print("Error Code:" + rescode)
댓글 없음:
댓글 쓰기