Overview
First, we will discuss what are the senior loans and why it makes sense to short senior loans at this point of the economic cycle (namely, credit products tend to perform poorly at late cycle and recession). Afterward, we will discuss why using CEFs to short senior loans might be a better proposition than shorting ETFs (namely, high fees and leverage). And, we will conclude with the rationale for choosing JQC among available CEFs to short (relatively favorable z-score).
JQC is a ticker for
Nuveen Credit Strategies Income Fund (
JQC), which is closed-end fund (“CEF”) managed by Nuveen (a big name in CEF industry). It invests predominantly senior loans (~80%) of non-investment grade (~75%). It carries baseline fee (management and other fees) of 1.35% and another 1.40% interest expense from leverage for a total expense of 2.75% for common shares (fund issues other securities as well, such as preferred shares).
What are the senior loans?
Senior loans (also known as leveraged loans or syndicated bank loans) are loans that banks make to corporations and then package and sell to investors. They are:
- Senior to other debt of the company and typically secured by collateral (e.g., PP&E)
- Floating rate instrument: yield resets based on some formula such as Libor + spread
- Typically made to non-investment grade companies
In credit risk and yield spectrum, senior loans would be between
investment-grade corporate bonds and high-yield bonds; likely closer to the latter. Floating rate nature of senior loans makes it attractive investment during increasing rate environment and good diversifier in fixed income portfolios. So far so good, but what happens at times of widening credit spreads? Senior loans, like any other credit product, would experience some major headwinds from widening credit spreads. This forms the basis for our “short senior loan” thesis.
As clock ticks, senior loans are getting “riskier”
Per S&P Global Market Intelligence, total leveraged debt outstanding (HY and leveraged loans) is now $2.7T, double the amount in 2007. Leveraged loans have risen from $0.5B in 2008 to $1.1T today. Howard Marks
notes that such an increase in leveraged loans driven mainly by demand from new collateralized loan obligations (“CLO”) and investors seeking floating-rate instruments.
It is not only the number of collateral loans that makes you wonder if this market might have overextended itself but also deteriorating quality. For instance, per S&P GMI, 75% of all leveraged loans were issued with covenant-lite features in 2017 vs. 29% in 2007. The same dynamic is happening in HY bond market as well. For instance, BB-rated bonds are coming to market with the looser covenants common in IG bonds.
You might think that a higher amount of issuance plus lower quality would translate to higher spreads, right? Wrong! Per S&P GMI, BB/BB- loans spreads are in 200-250 bps range nowadays vs. 300-400 bps in early 2018. In other words, both quality and risk premiums are lower. Is this driven by irrational animal spirits or rationally justified by lower expected future defaults?
It is not surprising that spirits are upbeat as we get to the later stages of the economic cycle, despite Q4’18 mayhem. That said, looser lending standards make you wonder how long can credit continue performing well. Howard Marks points out that “the greater the prosperity (and the lower the interest rates), the weaker the vigilance. It’s the vigilance deficit that crystalizes the errors that lead to a crisis of confidence”. And what could be worst to credit instruments than a crisis of confidence (e.g. credit crunch)?
For further discussion of credit underperformance during the late cycle, please refer to
my earlier article.
Shorting CEFs instead of ETFs: high fees and embedded leverage
There’s a peculiar observation: it seems that there’s only 5 bank loan ETFs with total AUM of $9.3B, per
ETFdb.com (of course, there might be a few others that did not make to
EFTdb.com), while over 32 senior loan CEFs with total AUM of $11.4B. If we exclude funds that have total assets below $100M, we would cut ETFs to 4 (FLBL would be dropped) and CEFs to 31 (OCCI would be dropped). In other words, there are ~8x more CEFs than ETFs when it comes to this market niche.
Why would that be more CEFs than ETFs? Is that because this niche provides a fertile ground for an alpha generation (CEFs are active vehicles vs. ETFs below are index products)? Or, perhaps, because CEFs provide significantly higher yield (mostly thanks to leverage)? Or maybe I’m just reading too much into the large number of CEFs (vs. ETFs) and should just note that total AUMs are comparable and move on.
Symbol
|
ETF Name
|
Total Assets ($MM)
|
Avg Volume
|
Previous Closing Price
|
1 year
|
3 year
|
5 year
|
|
|
|
$5,416
|
9,805,264
|
$21.81
|
-1.11%
|
10.41%
|
7.56%
|
|
|
|
$2,224
|
1,224,554
|
$44.75
|
-0.49%
|
8.27%
|
8.12%
|
|
|
|
$1,603
|
358,319
|
$45.44
|
-1.44%
|
8.20%
|
10.41%
|
|
|
|
$372
|
380,748
|
$17.13
|
-1.25%
|
9.12%
|
6.67%
|
|
|
|
$55
|
0
|
$24.32
|
N/A
|
N/A
|
N/A
|
BKLN is the largest senior loan ETF with over $5.4B of total assets. Its underlying index is S&P/LSTA U.S. Leveraged Loan 100 Index. CEFs, on the other hand, are actively managed product and does not typically track a specific index. Being actively managed products, CEFs tend to charge sizable management fees; ~2% would not be a surprise (median rate per the table below is 1.6%). Additionally, you would be implicitly paying for embedded leverage, which would be another 1-3%. Please note that no two CEFs are alike.
CEF ticker
|
Total Assets ($MM)
|
Avg. volume
|
Effective Leverage
|
Baseline Fee
|
Distribution rate
|
1-year z-score
|
Premium/ (discount)
|
1 year
|
3 year
|
5 year
|
|
|
1,005
|
4,760,000
|
36.49%
|
1.35%
|
6.30%
|
-0.4
|
(12%)
|
(5%)
|
5%
|
1%
|
|
|
180
|
710,000
|
39.36%
|
1.88%
|
6.10%
|
-0.6
|
(5%)
|
(1%)
|
--
|
--
|
|
|
227
|
1,260,000
|
36.25%
|
1.81%
|
6.46%
|
-0.8
|
(12%)
|
(3%)
|
7%
|
3%
|
|
|
224
|
790,000
|
33.91%
|
2.24%
|
8.30%
|
-1.0
|
(12%)
|
(4%)
|
6%
|
3%
|
|
|
525
|
1,870,000
|
37.03%
|
1.37%
|
7.77%
|
-1.1
|
(12%)
|
(11%)
|
4%
|
2%
|
|
|
212
|
1,170,000
|
37.41%
|
1.44%
|
7.75%
|
-1.2
|
(13%)
|
(9%)
|
6%
|
2%
|
|
|
108
|
290,000
|
36.20%
|
1.43%
|
6.37%
|
-1.4
|
(14%)
|
(8%)
|
6%
|
2%
|
|
|
761
|
2,050,000
|
29.86%
|
1.94%
|
25.91%
|
-1.4
|
(16%)
|
(5%)
|
7%
|
3%
|
|
|
366
|
1,580,000
|
36.52%
|
1.40%
|
8.00%
|
-1.4
|
(14%)
|
(15%)
|
5%
|
1%
|
|
|
245
|
2,690,000
|
37.38%
|
4.35%
|
16.79%
|
-1.4
|
(3%)
|
13%
|
21%
|
8%
|
|
|
664
|
4,130,000
|
27.70%
|
1.63%
|
7.18%
|
-1.4
|
(15%)
|
(6%)
|
2%
|
1%
|
|
|
517
|
1,660,000
|
31.49%
|
0.91%
|
8.35%
|
-1.5
|
(14%)
|
(9%)
|
6%
|
3%
|
|
|
704
|
4,840,000
|
29.06%
|
1.60%
|
14.38%
|
-1.5
|
(14%)
|
(6%)
|
5%
|
1%
|
|
|
89
|
340,000
|
32.43%
|
1.40%
|
7.09%
|
-1.5
|
(14%)
|
(9%)
|
4%
|
1%
|
|
|
602
|
1,480,000
|
33.18%
|
2.02%
|
9.70%
|
-1.7
|
(12%)
|
(4%)
|
10%
|
3%
|
|
|
462
|
1,270,000
|
35.31%
|
1.30%
|
6.90%
|
-1.7
|
(12%)
|
(8%)
|
7%
|
3%
|
|
|
175
|
620,000
|
37.76%
|
1.71%
|
10.17%
|
-1.8
|
(12%)
|
(4%)
|
11%
|
4%
|
|
|
299
|
890,000
|
29.24%
|
1.25%
|
6.39%
|
-1.8
|
(15%)
|
(8%)
|
3%
|
1%
|
|
|
505
|
1,230,000
|
34.91%
|
1.27%
|
6.52%
|
-1.9
|
(13%)
|
(6%)
|
6%
|
3%
|
|
|
243
|
900,000
|
31.93%
|
1.25%
|
7.30%
|
-1.9
|
(15%)
|
(9%)
|
3%
|
1%
|
|
|
273
|
710,000
|
29.79%
|
1.19%
|
6.43%
|
-2.0
|
(13%)
|
(12%)
|
3%
|
2%
|
|
|
110
|
260,000
|
29.84%
|
2.13%
|
8.16%
|
-2.0
|
(14%)
|
(6%)
|
5%
|
3%
|
|
|
443
|
1,600,000
|
29.29%
|
1.19%
|
6.55%
|
-2.1
|
(14%)
|
(9%)
|
3%
|
2%
|
|
|
317
|
800,000
|
30.18%
|
1.97%
|
9.38%
|
-2.3
|
(16%)
|
(9%)
|
10%
|
3%
|
|
|
234
|
470,000
|
33.01%
|
2.04%
|
8.23%
|
-2.4
|
(7%)
|
(6%)
|
9%
|
3%
|
|
|
145
|
430,000
|
37.56%
|
1.51%
|
8.76%
|
-2.4
|
(12%)
|
(8%)
|
6%
|
2%
|
|
|
296
|
1,090,000
|
25.63%
|
1.32%
|
6.04%
|
-2.8
|
(8%)
|
(4%)
|
--
|
--
|
|
|
61
|
260,000
|
--
|
3.62%
|
11.23%
|
-2.8
|
(14%)
|
(15%)
|
--
|
--
|
|
|
137
|
700,000
|
29.50%
|
2.25%
|
13.75%
|
-3.0
|
(14%)
|
(18%)
|
8%
|
0%
|
|
|
321
|
980,000
|
33.85%
|
3.29%
|
16.90%
|
-3.4
|
(13%)
|
(14%)
|
10%
|
--
|
|
|
918
|
1,390,000
|
29.28%
|
1.71%
|
7.33%
|
-3.6
|
(11%)
|
(14%)
|
--
|
--
|
Median
|
296
|
1,090,000
|
33.10%
|
1.60%
|
7.77%
|
-1.7
|
(13%)
|
(8%)
|
6%
|
2%
|
Source: www.cefconnect.com (Note: OCCI was excluded given a low market cap of $38M and recent inception)
You might have noticed that all CEFs with exception of OXLC have negative 1-year performance. We will not spend much time discussing OXLC in this article (I intended to dedicate a separate article to this CEF); suffice it to say that OXLC is 98% invested in equity tranches of various CLOs (collateralized loan obligations) and, therefore, is not really comparable to other CEFs that invest in rated tranches of senior loans. It is one thing to invest in BB-heavy senior loan CEF, it is quite another to invest in CEF that is heavily invested in equity tranches. The equity (or residual) tranche is the first tranche that absorbs any losses of CLO and, hence, tends to have the highest expected yield. That said, higher risk does not always translate to a higher return.
Coming back to JQC, the fund has 36% of effective leverage. Think of every $1 of investment in JQC giving you $1.36 exposure to senior loans portfolio. It results in higher price volatility, but more importantly, leverage enables the fund to pay hefty 6.3% dividend. In all fairness, trading at 12% discount also helps with a high dividend rate. Think of it this way, you can buy a portfolio of senior loans with weighted average current yield of 5.5% in ETF structure, however the same portfolio in CEF structure might be trading at 12% discount (i.e. CEF itself is trading at 12% discount to NAV) that means that current yield on CEF would be 6.3% (i.e. 5.5% / (1 – 12%)). Now that we started talking about discounts, let’s explore it in a little bit more detail.
Another crucial difference between ETFs and CEFs: premiums and discounts
ETFs trade effectively at their NAV (potentially with very minor discrepancies) thanks to redemption mechanism. This mechanism ensures that any time market price of a share of ETF moves too far away from NAV, authorized participants would be able to buy up components of ETF in the right proportion and deliver it to ETF provider in exchange for ETF shares.
Unlike ETFs, CEFs do not allow for the creation or redemption of new units. In other words, once CEF is formed, no more new money or “creation units” comes into the fund. This means that there is no mechanism that enables NAV and market price convergence on an ongoing basis. As a result, CEFs can trade at discount or premium for extended periods of time.
CEFs that are well managed (or lucky), in theory, should be able to command some level of premium. Why would anyone pay $1.2 for $1.0 of the portfolio? Wouldn’t it be better just to replicate such CEF by buying up CEF’s portfolio components (including leverage) and avoiding material management fees? No comments!
Majority of CEFs, however, trades at discount. Is that due to investors believe that managers of these funds cannot earn their keep (i.e. outperform sufficiently to overcome management fee drag)? No comments (again)!
Even though a particular CEF might tend to trade at a discount, actual discount amount as % of NAV varies over time. Over the medium or long-term, discount tends to show some level of mean reversion. In other words, if a CEF is trading at 25% discount but historically it used to trade at 5% average discount, there’s a good chance that at some point discount will shrink back to amount closer to 5%. You might have guessed by know that industry has developed a metric to show how large or small is a discount (or premium) vs. historical average that would take account volatility of such discount (or premium). Of course, it is named z-score (surprise!).
There might be a number of reasons why a discount might be significantly larger than historical averages. It would, typically, boil down to demand. The lower the demand, the higher is the discount. At times of market distress, CEFs tend to experience increased discounts. However, there are mini-cycles as well that might be specific to a particular asset class or particular CEF.
The rationale for shorting specifically JQC (vs. other senior loan CEFs)
Looking at the earlier table of 30+ CEFs, you might be wondering why JQC was singled out. It has a 12% discount rate, which is close to a median 13% rate. On another hand, BSL is trading at 7% discount. How shall we think about it?
CEF ticker
|
Total Assets ($MM)
|
Avg. volume
|
Effective Leverage
|
Baseline Fee
|
Distribution rate
|
1-year z-score
|
Premium/ (discount)
|
1 year
|
3 year
|
5 year
|
|
|
1,005
|
4,760,000
|
36.49%
|
1.35%
|
6.30%
|
-0.4
|
(12%)
|
(5%)
|
5%
|
1%
|
|
|
234
|
470,000
|
33.01%
|
2.04%
|
8.23%
|
-2.4
|
(7%)
|
(6%)
|
9%
|
3%
|
Let’s consider two scenarios:
- Market participants continue to take funds out of senior loan products
- Market participants suddenly reverse their views of senior loan products and start buying in massive quantities
In the case of scenario #1, CEFs would have poor NAV performance due to increase in credit spreads (selling pressure likely to drive up spreads) and increase in discount (CEF discounts are sensitive to fund inflows/outflows). It would be hard to say which CEF would see a larger increase in discount rate, however one might make a generalized statement (i.e., not always true) that there is a higher likelihood that low absolute z-score CEF (i.e. JQC in this case) would have more room to experience widening discount than other CEF (i.e., BSL). Of course, this is something that one can think of intuitively making sense. That said, when the market turns sour, everyone might end up running to the exit. In that case, one can argue that less liquid BSL would see more downward price action.
In the case of scenario #2, the same logic would say that JQC would have less room to run up the premiums than more heavily discounted BSL Again, I’m using z-score as an indicator of how heavy particular CEF is discount. Comparing discount percentages across CEFs would not be an apples-to-apples comparison. Assuming the above-mentioned rationale holds in practice, shorting JQC would result in less pain than shorting BSL under this scenario (JQC would experience relatively lower price increase compared to BSL).
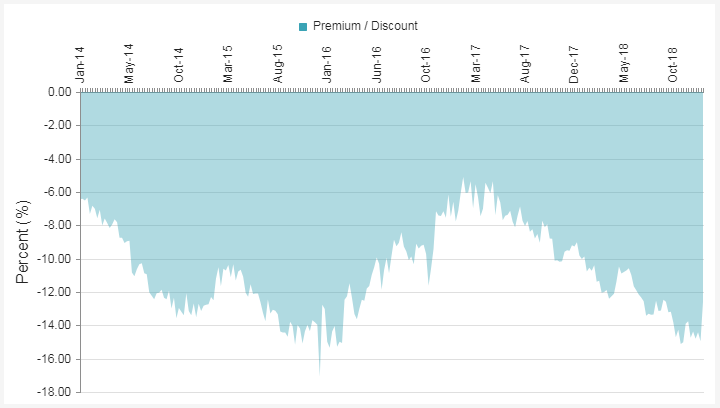
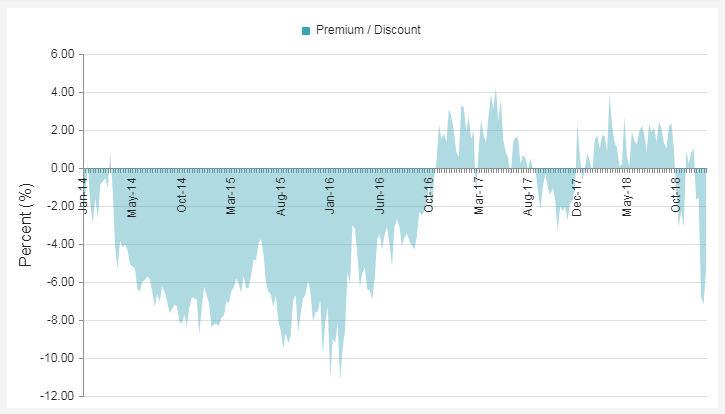
For your reference, below are 5-year historical premium/discount rates for JQC and BSL.
5-year historical premium/discount rates for JQC (Source: CEFconnect)
5-year historical premium/discount rates for BSL (Source: CEFconnect)
That said, major drivers of performance of CEFs are likely going to be structural leverage (which generally tends to be somewhat stable) and underlying portfolio NAV. Latter would be impacted by overall credit spreads and issue-specific performance (i.e. particular senior loan structure). Issue-specific performance would be hard to forecast given ad-hoc nature, while overall credit spreads are something that you can make some informed call/ bet. In other words, most of the performance of senior loan CEFs are likely going to be driven by credit spreads rather than relative z-scores. In the light of this one might argue that use of z-scores is achieves nothing but false precision.
Conclusion
To summarize the article again:
- Shorting senior loans at this point of economic cycle makes sense as credit products tend to perform poorly at late cycle and recession. This is driven by increased risk appetite of market participants that tend to result in lower quality (e.g. covenant-lite) loans getting priced more dearly (i.e. with tighter spreads). Paying the high price for low quality might work in short-term thanks to momentum and/or animal spirits, but tends to be a poor long-term investment strategy.
- Using CEFs to short senior loans might be a better proposition than shorting ETFs mostly thanks to higher fees charged by CEFs and leverage. If or when senior loans start underperforming materially, CEFs would perform worse than comparable ETFs as both relatively high fees and leverage would exacerbate downward move.
- JQC was chosen as a potential candidate for shorting among senior loan CEFs mostly due to its relatively favorable z-score.
Ultimately, every reader would make their own call (note that nothing in this article is meant to be an investment advice; please consult your judgment and/or your financial advisor before making any investment): 1) whether it makes sense to short senior loans at this stage, 2) if answer to question 1 is ‘yes’, whether to short using ETFs or CEFs, and 3) if answers to questions 1 is ‘yes’ and to question 2 is ‘CEF’, whether to short JQC or some other CEF from the list.
Disclosure: I/we have no positions in any stocks mentioned, but may initiate a short position in JQC over the next 72 hours. I wrote this article myself, and it expresses my own opinions. I am not receiving compensation for it (other than from Seeking Alpha). I have no business relationship with any company whose stock is mentioned in this article.